2.2 Using the Interface
The FishVue Interpret interface is divided into several main areas: a time series view (top), a calendar (top right), a map (bottom), and a cruise track table (inset).
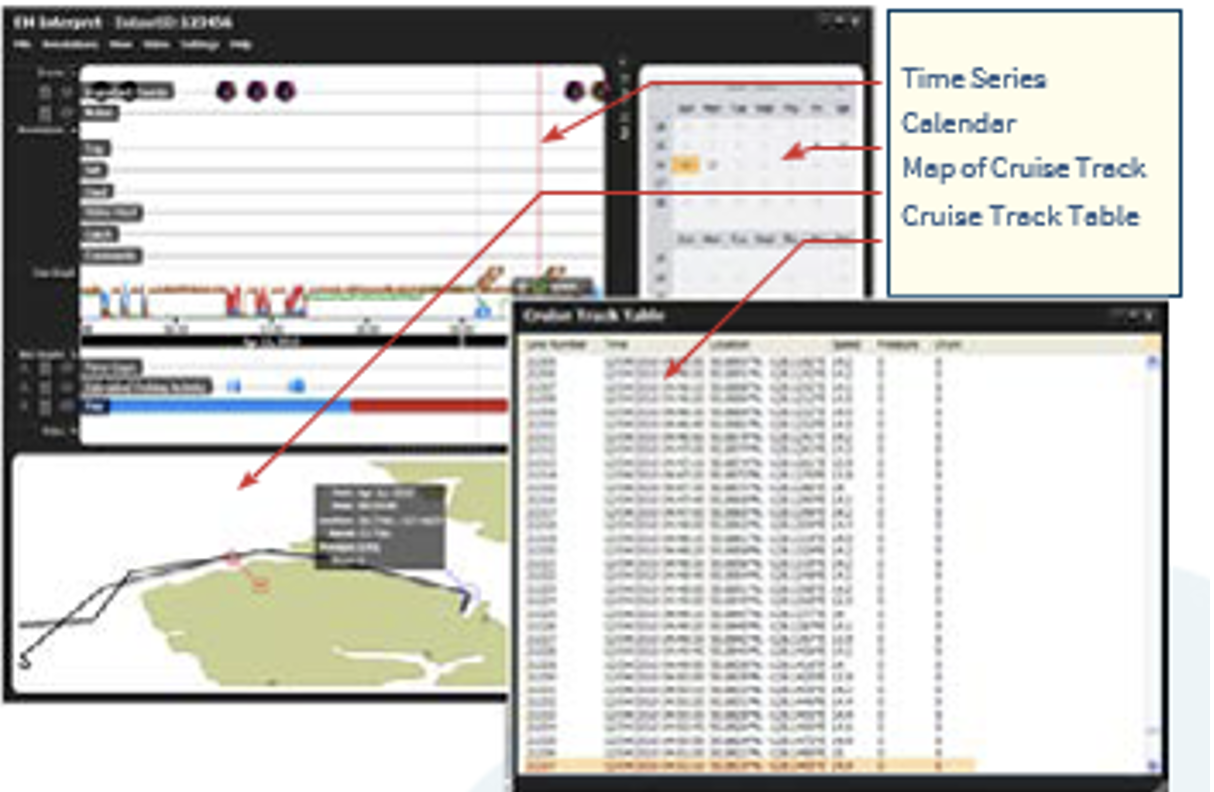
Each area in the FishVue Interpret interface presents the vessel’s sensor data in a different way, combining to give an integrated view of fishing activity at sea.
- Time Series:
The time series at the top of the window provides a visual overview of the data. It shows events, annotations, line graphs, box graphs, and video recording times. Pointing the mouse at any item or event in the time series highlights the corresponding cruise track position on the map. - Map:
The map shows the vessel’s cruise track for the entire data set, or for selected days. Pointing anywhere along the cruise track displays a summary of date, time, and location, as well as pressure, drum, and speed readings. It also highlights the related data in the time series display. - Calendar:
The calendar in the top-right corner highlights each day covered by the vessel’s cruise track. Clicking a highlighted day filters the time series and map to show only the EM data for that day. - Cruise Track Table:
The cruise track table (available from the View menu) lists the sensor data for each record in tabular form.
2.2.1 Navigating the UI of FishVue Interpret
Once you’ve loaded a data set, FishVue Interpret provides several ways to navigate, change views, and explore the data.
Zooming in and out
- Roll the mouse wheel forward or backward to zoom in or out on any part of a time series or map.
- Or, position the mouse pointer over a time series or map, hold down the mouse wheel button, and drag to draw a box around the area you want to zoom into.
Panning the view
- When zoomed in, hold the left mouse button and drag to move a graph left or right, or to move the map in any direction.
Viewing information for a specific point
- On a time series or map, hover the mouse pointer over any data point to view a summary for that point.
Highlighting time series, map, and video
- Double-click any point on a time series or the map to highlight that time in the time series and mark the corresponding location on the map in red.
- If there is associated video (and the video display is open), FishVue Interpret will show the relevant video clip for that point.
Showing or hiding time series displays
To hide or show any of the time series displays:
- Click the hide/show button on that time series to toggle its visibility.
Increasing the size of the line graphs
To make the line graphs area larger:
- Hide one or more displays above or below the line graphs using their hide/show buttons.
- Or drag the border between the map and box graphs sections upward or downward to reduce the map and increase the graph area.
2.2.2 Using Icons
FishVue Interpret uses several icons to indicate actions that you can perform within the program. Some of these can be seen to the left of the time series section (near the top of the screen).
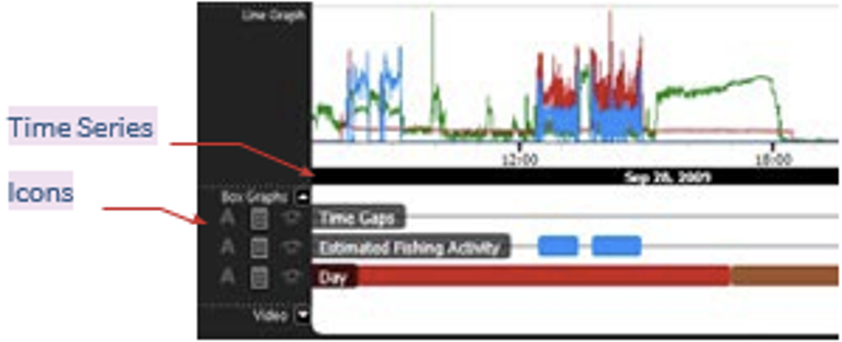
Clicking on any of these icons modifies the value directly adjacent to the icon. The following table depicts each of these icons and describes its corresponding function:
| Icon | Function | Description |
 | Edit | Click Edit to open a window where you can modify an item’s options and variables |
 | Show | Clock Show to display or hide the associated value on the time series or map |
 | Copy | Click Copy to create a duplicate version of an item that you can then edit |
 | Delete | Click Delete to remove an item |
 | Display | Click Display to open a window listing details of the corresponding item |
 | Restore | Click Restore to reset a function to the default setting |
 | Auto-annotate | (FishVue Interpret Pro only) Click Auto-annotate to automatically annotate a data set based on the estimated fishing activity |
  | Show/Hide | Click the (left/right) Show or Hide buttons to maximize or minimize the item |
  | Show/Hide | Click the (up/down) Show or Hide buttons to maximize or minimize an item |
 Previous Chapter
Was this article helpful?
That’s Great!
Thank you for your feedback
Sorry! We couldn't be helpful
Thank you for your feedback
Feedback sent
We appreciate your effort and will try to fix the article